cat2cat
About
Unifying an inconsistently coded categorical variable in a panel/longitudinal dataset
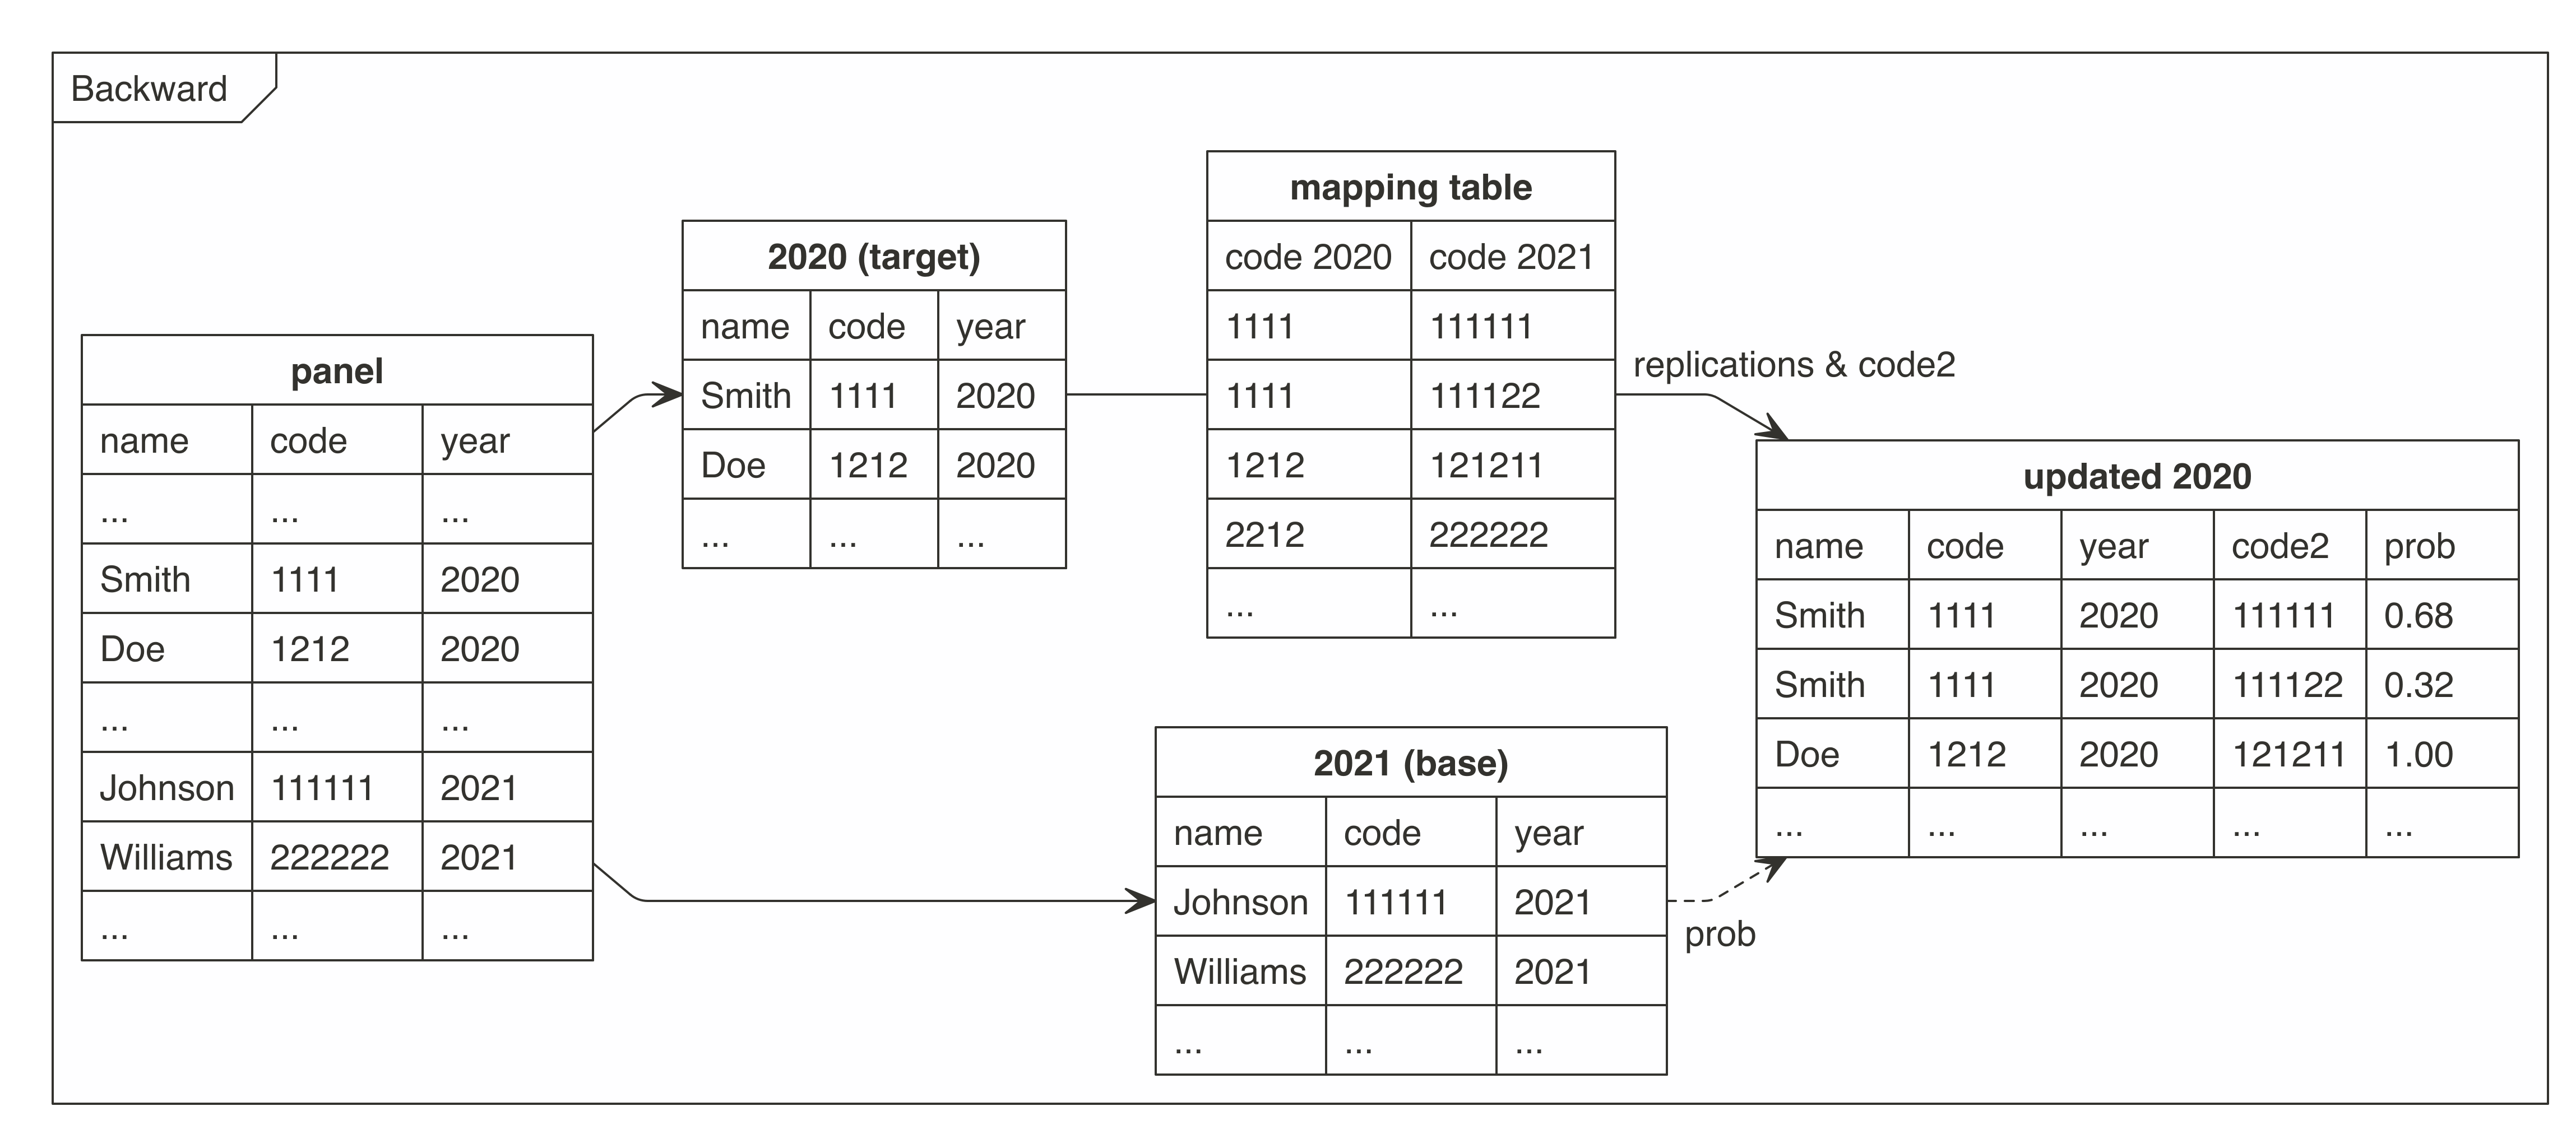
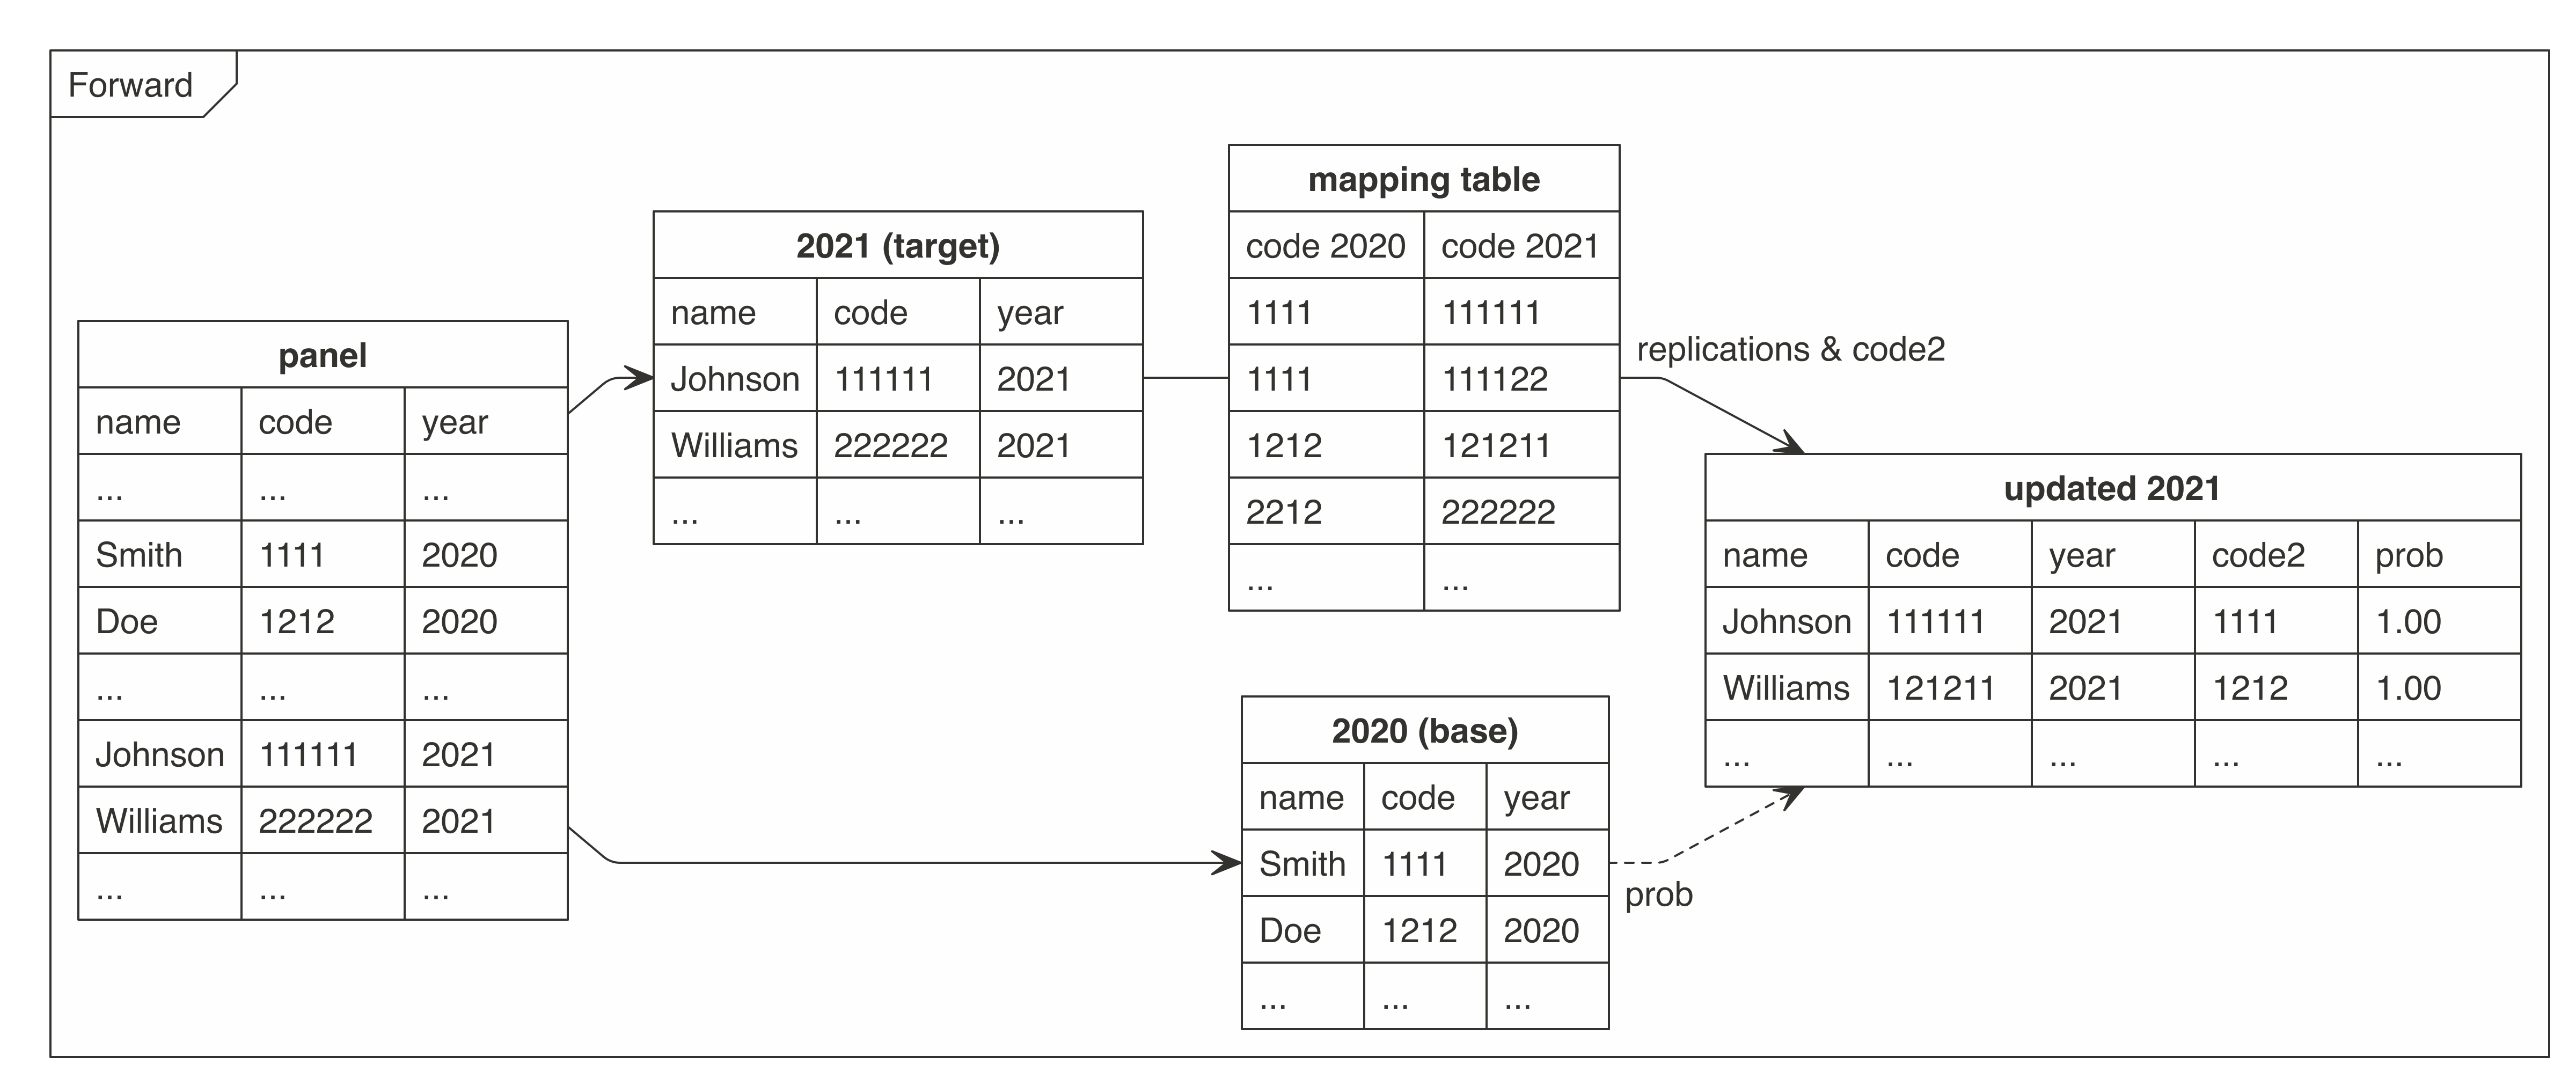
The cat2cat procedure maps a categorical variable according to a mapping (transition) table between two different time points. The mapping (transition) table should have a candidate for each category in the period being harmonized. The main rule is to replicate an observation if it can be assigned to several categories, then use frequencies or statistical methods to approximate probabilities of assignment.
This algorithm was invented and implemented in the paper by (Nasinski, Majchrowska and Broniatowska (2020)).
For more details please read the paper by (Nasinski, Gajowniczek (2023)).
Graph - cat2cat procedure
The graphs present how the cat2cat function (and the underlying procedure) works, in this case under a panel dataset without the unique identifiers and only two periods.
Example usage
To use cat2cat in a project:
Load example data
# cat2cat datasets
from cat2cat.datasets import load_trans, load_occup, load_verticals
from numpy.random import seed

seed(1234)

trans = load_trans()
occup = load_occup()
verticals = load_verticals()
Low-level functions
from cat2cat.mappings import get_mappings, get_freqs, cat_apply_freq

# convert the mapping table to two association lists
mappings = get_mappings(trans)
# get variable-level frequencies
codes_new = occup.code[occup.year == 2010].values
freqs = get_freqs(codes_new)
# apply the frequencies to the (one) association list
mapp_new_p = cat_apply_freq(mappings["to_new"], freqs)

# mappings for a specific category
print(mappings["to_new"]['3481'])
# probability mappings for a specific category
print(mapp_new_p['3481'])
cat2cat procedure - one iteration
from cat2cat import cat2cat
from cat2cat.dataclass import cat2cat_data, cat2cat_mappings, cat2cat_ml

from pandas import concat

# split the panel by the time variable
# here only two periods
o_old = occup.loc[occup.year == 2008, :].copy()
o_new = occup.loc[occup.year == 2010, :].copy()

# dataclasses, two core arguments for the cat2cat function
data = cat2cat_data(
    old = o_old,
    new = o_new,
    cat_var_old = "code",
    cat_var_new = "code",
    time_var = "year"
)
mappings = cat2cat_mappings(trans = trans, direction = "backward")

# apply the cat2cat procedure
c2c = cat2cat(data = data, mappings = mappings)
# pandas.concat used to bind per period datasets
data_final = concat([c2c["old"], c2c["new"]])

sub_cols = ["id", "edu", "code", "year", "index_c2c", "g_new_c2c", "rep_c2c", "wei_naive_c2c", "wei_freq_c2c"]
data_final.groupby(["year"]).sample(5).loc[:, sub_cols]
With ML
from sklearn.ensemble import RandomForestClassifier
from cat2cat import cat2cat_ml_run

o_new["edu_group"] = o_new["edu"].astype(str)
o_old["edu_group"] = o_old["edu"].astype(str)

# ml dataclass, one of the arguments for the cat2cat function
ml = cat2cat_ml(
    data = o_new,
    cat_var = "code",
    features = ["salary", "age", "edu_group"],
    models = [RandomForestClassifier(n_estimators = 50, random_state = 1234)],
    on_fail = "freq",
    fail_warn = True
)

# Reports accuracy, Brier score, and mean P(true class).
cat2cat_ml_run(mappings, ml)

# apply the cat2cat procedure
c2c = cat2cat(data = data, mappings = mappings, ml = ml)
# pandas.concat used to bind per period datasets
data_final = concat([c2c["old"], c2c["new"]])

sub_cols = ["id", "year", "wei_naive_c2c", "wei_freq_c2c", "wei_RandomForestClassifier_c2c"]
data_final.groupby(["year"]).sample(3).loc[:, sub_cols]
Categorical/object/string features such as edu_group are one-hot encoded with
levels from both the ML data and the target period. Failed ML probabilities are
handled according to on_fail: "freq", "naive", "na", or "error".
With 4 periods, one mapping table and backward direction:
from cat2cat.cat2cat_utils import dummy_c2c

# split the panel by the time variable
# here four periods
o_2006 = occup.loc[occup.year == 2006, :].copy()
o_2008 = occup.loc[occup.year == 2008, :].copy()
o_2010 = occup.loc[occup.year == 2010, :].copy()
o_2012 = occup.loc[occup.year == 2012, :].copy()

# dataclasses, two core arguments for the cat2cat function
data = cat2cat_data(
    old = o_2008,
    new = o_2010,
    cat_var_old = "code",
    cat_var_new = "code",
    time_var = "year"
)
mappings = cat2cat_mappings(trans = trans, direction = "backward")

# apply the cat2cat procedure
occup_back_2008_2010 = cat2cat(data = data, mappings = mappings)

# updated for the next iteration data cat2cat argument
data = cat2cat_data(
    old = o_2006,
    new = occup_back_2008_2010["old"],
    cat_var_old = "code",
    cat_var_new = "g_new_c2c",
    time_var = "year"
)

# apply the cat2cat procedure
occup_back_2006_2008 = cat2cat(data = data, mappings = mappings)

# gather the datasets for each period
o_2006_n = occup_back_2006_2008["old"]
o_2008_n = occup_back_2006_2008["new"] # or occup_back_2008_2010["old"]
o_2010_n = occup_back_2008_2010["new"]
o_2012_n = dummy_c2c(o_2012, "code")

# pandas.concat used to bind per period datasets
data_final = concat([o_2006_n, o_2008_n, o_2010_n, o_2012_n])

sub_cols = ["id", "edu", "code", "year", "index_c2c",
 "g_new_c2c", "rep_c2c", "wei_naive_c2c", "wei_freq_c2c"]
data_final.groupby(["year"]).sample(2).loc[:, sub_cols]
Prune - prune_c2c
Pruning which could be useful after the mapping process, the custom prune_fun is provided by the end user. The prune_fun is a function that processes a 1D array of weights (float) and returns a 1D boolean array of the same length. The weights are reweighted automatically to still sum to one for each original observation.
non-zero - lambda x: x > 0
highest1 - lambda x: arange(len(x)) == argmax(x)
highest - lambda x: x == max(x)
from cat2cat.cat2cat_utils import prune_c2c
from numpy import arange, argmax

# prune_c2c
# highest1 leaves only one observation with the highest probability for each original one
(o_2006_n.shape[0],
 prune_c2c(o_2006_n, lambda x: arange(len(x)) == argmax(x)).shape[0])
Direct match
It is important to set the id_var argument as then we merging categories 1 to 1
for this identifier which exists in both periods.
# split the panel by the time variable
vert_old = verticals.loc[verticals["v_date"] == "2020-04-01", :]
vert_new = verticals.loc[verticals["v_date"] == "2020-05-01", :]

## extract mapping (transition) table from data using identifier
trans_v = vert_old.merge(vert_new, on = "ean", how = "inner")\
.loc[:, ["vertical_x", "vertical_y"]]\
.drop_duplicates()
# dataclasses, two core arguments for the cat2cat function
data = cat2cat_data(
  old = vert_old,
  new = vert_new,
  id_var = "ean",
  cat_var_old = "vertical",
  cat_var_new = "vertical",
  time_var = "v_date"
)
mappings = cat2cat_mappings(trans = trans_v, direction = "backward")

# apply the cat2cat procedure
verts = cat2cat(
  data = data,
  mappings = mappings
)

# pandas.concat used to bind per period datasets
data_final = concat([verts["old"], verts["new"]])
Direct match with ML
# ml dataclass, one of the arguments for the cat2cat function
from sklearn.neighbors import KNeighborsClassifier
ml = cat2cat_ml(
    data = vert_old,
    cat_var = "vertical",
    features = ["sales"],
    models = [KNeighborsClassifier()]
)
# apply the cat2cat procedure
verts_ml = cat2cat(
  data = data,
  mappings = mappings,
  ml = ml
)
# pandas.concat used to bind per period datasets
data_final = concat([verts_ml["old"], verts_ml["new"]])